Class Overview
These are categorized based on the Core Inference Model. Might be better to organize around “The Essential Components”…
Epistemological Foundations: What Counts as Knowledge?
Antiquity (350 BC – 500 AD)
- Plato: the world of ideas, emphasis on reasoning from ideas, knowledge arrived at logically, universal forms (rule-based reasoning)
- Aristotle: the world of nature, emphasis on observation and classification, logic (syllogism), specific instances (case-based reasoning)
- Idealism (Plato): world of perfect forms/ideas understood innately
- Realism (Aristotle): no perfect forms, world understood through observation
Middle Ages (500–1300)
- Decay of science for 1500 years, domination of theology
- Geocentric view of cosmos dictated by church
- Emergence of universities in Europe, rediscovery of Aristotle
- Attempts at reconciliation: Thomas Aquinas, Roger Bacon
Renaissance (1300–1600)
- Nicholas Copernicus: rejection of doctrine, challenge to Aristotle, heliocentric model developed through observation
- Recognition of value of scientific discoveries (universities to courts and laboratories)
- Expanded outreach exposed European scholars to other traditions (India, China)
- Printing press enabled dissemination
- Shift to scientific method democratized discovery
Enlightenment (1600–1800)
- René Descartes: rationalism, relationship between physical world and metaphysics, tree metaphor (unobservable roots = metaphysics, observable trunk = reality), “I think therefore I am,” skepticism as method
- Francis Bacon: empiricism, criticized Plato and Aristotle for over-reliance on logic, inductive reasoning from fact → axiom → law, first modern philosopher of science
- Inductive (Bacon): from facts to theories; Deductive (Aristotle, Descartes): from theories to facts through logic
- Isaac Newton: precise mathematical description of natural phenomena, calculus, founder of physics, general laws governing terrestrial and celestial objects, combined deduction with inductive reasoning, hypothesis testing
- David Hume: the problem of induction (cannot know what is not directly observable, induction requires assumption of rationality which cannot be supported), Hume’s fork (knowledge about ideas vs. knowledge about facts)
- Immanuel Kant: rejected notion that ALL knowledge comes from experience, a priori knowledge, distinction between ontology and epistemology, human capacity for forming mental representations of reality
Modern Period (1800–1945)
- Georg Wilhelm Friedrich Hegel: extending idealism beyond Kant, thinking is mental and physical, role of history in shaping knowledge, dialectical method
- Auguste Comte: positivism — knowledge based purely on facts and logic, mathematics as superior science, science should be useful to society; Émile Durkheim — positivist approach to social science
- Wilhelm Dilthey: social world can never be explained same as natural world, we explain nature but only understand the human world, interpretivist position
- Charles Darwin: theory of evolution, parsimony (simplest explanation), the maid and the cheese example
- Early 20th century revolution in physics: relativity, quantum mechanics, departure from Newtonian laws; Schrödinger, Dirac, Einstein, Planck; mathematical reasoning as prior to observation; discovery of new particles never observed (Dirac); departure from deductive-inductive dichotomy
- Vienna Circle (1924–1936): logical positivism, denial of a priori knowledge, reliance on logic and rational analysis, verifiability criterion, reductionism (any system understood as sum of parts), rejection of methodological divide between natural and social science
- Phenomenology: Edmund Husserl (study of phenomena from experiential point of view), Martin Heidegger (existential phenomenology, essence of being, ready-to-hand / present-at-hand)
- Ethics in science: Manhattan Project, Nuremberg trials, Nuremberg Code — first formulation of principles of ethical conduct
Late Modern Period (1945–today)
- Postmodernism: Jean-Paul Sartre (existentialism, consciousness, freedom of choice), Lyotard, Derrida, Jameson, Foucault, Latour; science as social construction, scientific method not superior to other ways of knowing, facts as social constructs, truth as subjective, science as discourse, science has politics, science as tool of oppression
- Postmodern critique: Bruno Latour (Laboratory Life), Marcel Kuntz (“The Postmodern Assault on Science” — assault on objective knowledge erodes trust in science, rejection of science leaves void from science to politics, case study of genetically modified organisms)
Key Philosophers of Science
- Karl Popper (1902–1994): demarcation as fundamental problem, rejection of classical empiricism (all observation is selective and theory-laden), principle of falsifiability (can only refute/falsify, not confirm), black swan example
- Thomas Kuhn (1922–1996): Structure of Scientific Revolutions, paradigm shifts (normal science within existing paradigm, shift when new evidence overwhelmingly rejects previous paradigm), science as social enterprise, rejection of old paradigms often coincides with new generation of scientists
- Paul Feyerabend (1924–1994): epistemological anarchy, pre-scientific knowledge not yet explained in scientific terms, science as convenient fairy tale, “anything goes”
- Jürgen Habermas (1929): communicative rationality, situating rationality in communication and speech-act theory, democratization of science
- Scientific realism: Bas van Fraassen, Ernan McMullin, Richard Boyd — theories as historical process toward true account of physical world, each theory consistent with evidence is at least partially true, each theory only partial and incomplete
Computational Philosophy of Science
- Physics influence on philosophy (early 1900s), computing influence (1960s)
- Herbert Simon (1916–2001): decision-making within organizations, bounded rationality and satisficing, scientific discovery as human problem-solving, cognition as manipulation of mental representations studied through simulation
- Big data and science: from samples to populations, experiment vs. observation, statistical crisis (“when everything is significant, what is meaningful?”), role of theory, challenges of relying on data (Redelmeier & Tversky arthritis/weather example)
- Critical questions for big data (danah boyd and Kate Crawford): inequalities written into systems, three classes of people (creators, collectors, analyzers), privilege of the analyst class, institutional inequalities producing bias
- Artificial intelligence: what is intelligence, utility vs. general intelligence, role of humans, AI as super intelligence vs. AI as normal technology (Kokotajlo et al. vs. Narayanan & Kapoor)
1. Truth in Universe → Research Question
1.1 Research Motivation
- Need to answer a question; inquiry; search for answers
- Research is scholarly or scientific inquiry: cumulative, methodologically rigorous
- Answers lead to improvement: improve human lives, advance science
- Sources of motivation: personal interest, critical need, literature and work in the field, external priority
1.2 Qualities of Good vs. Bad Research
- Good: addresses important questions, impact on science and society, answers questions asked, direct relation between questions and conclusions, rigorous/unbiased/valid/replicable, methods appropriate, bias minimized, generalizable
- Bad: insignificant questions, methods don’t match questions, invalid/biased/not replicable, not generalizable
1.3 Formulating Research Questions
- From general interest to specific questions: defining area of interest, identifying specific questions, operationalizing questions and identifying methods
- The way you define research questions determines methods
- Worked example: “How can HIT improve clinical communication?” → four different specific questions, each with different design, subjects, variables, and statistics
- What to study in informatics:
- Clinician-focused (communication, information needs, information sharing, adherence to guidelines, errors, decision-making)
- Patient-focused (self-management, engagement, health communities),
- Intervention types (decision support, communication tools, summarizers)
1.4 The FINER Framework
- Feasible
Adequate subjects, technical expertise, affordable in time and money, manageable scope - Interesting
To the investigator, to all stakeholders - Novel
Provides new findings, confirms or refutes previous findings, extends previous findings - Ethical
Risk to subjects, ethical in interpretation - Relevant
To scientific knowledge, clinical and health policy, biomedical informatics, future research directions
1.5 Types of Research Goals
- Exploration
What are significant properties of a particular phenomenon? - Hypothesis testing
Is there a difference between X and Y? - Theory testing
Does theory X explain Y and Z?
1.6 From Questions to Hypotheses
- A statement about phenomena connected to research questions, referring to population not sample
- Association between predictor and outcome, probability that association is due to chance, plausibility of causation
- Also asks: potential confounders, threats to validity, biases, limitations
- A good hypothesis: begins with well-formed question, grounded in existing theory, testable, simple (one predictor, one outcome), specific, stated in advance, falsifiable
- Theoretical hypothesis → testable/statistical hypothesis (sample, predictor, outcome)
- Hypothesis-generating study: when relationships unclear and you can’t form a hypothesis
- Null hypothesis: what we wish to disprove (no relationships/differences); alternative hypothesis: the actual hypothesized association (two-sided preferred, more conservative; one-sided: specified direction)
- Falsifiability: presumed “innocent” (null true), burden toward building case that difference exists; rejecting null does not guarantee alternative is true
- Importance of stating hypotheses in advance: enables non-ambiguous evaluation, minimizes multiple comparisons and p-hacking
1.7 Frameworks & Their Building Blocks
A Framework is a conceptual model, a set of highly abstract, related constructs. It explains phenomena of interest, expresses assumptions, and reflects a philosophical stance. It is broad and not directly testable on its own.
- Concept: term that abstractly defines an object, phenomenon, or idea (directly observable or agreed-upon, e.g. “anxiety” or “justice”)
- Construct: concept that cannot be directly observed (emotional response, satisfaction)
- Variable: operationalized construct, measurable (“palmar sweating” for some emotional response)
- Concept synthesis, concept derivation, concept analysis
- Relational statements: direction, shape, strength, symmetry, sequencing, probability, necessity, sufficiency
- Shape of a relationship (e.g., learning vs. stress: inverted-U)
- Conceptual model: set of highly abstract, related constructs; explains phenomena, expresses assumptions, reflects philosophical stance
- Theory: narrow and testable conceptual model; set of concepts, existence statements, relational statements; describe, explain, predict, or control a phenomenon
- Developing a framework: select and define concepts, develop relational statements, develop hierarchical statement set, construct conceptual map
- Conceptual map: diagrams interrelationships; requires clear problem/purpose, concepts, integrative review, identification of existing theories and models, linking relationships with hypotheses
“Burnout” is a Concept. When you pick a theory, you are committing to its definition of a vague and fuzzy concept. E.g.
- Emotional exhaustion
- Depersonalization (cynicism toward work)
- Reduced sense of personal accomplishment
are the definitions of “Burnout” in Christina Maslach’s framework. These are Constructs.
A Variable here, in her Framework, would be the Maslach Burnout Inventory Score (0–132). It has operationalized the construct.
1.8 Theories
A theory is a narrow and testable conceptual model. It consists of a specific set of concepts, existence statements, and relational statements that describe, explain, predict, or control a phenomenon.
- Research is theoretically grounded: theory provides direction, concepts, constructs, variables
- Impact of theory selection: different theories provide different lens for same empirical findings
- Choice of framework defines selection of variables and design of interventions
- “One of the primary jobs of a theory is to help us look in the right place for answers to questions” (Ed Hutchins)
- Diabetes self-management example: decision-making vs. problem-solving vs. sensemaking lenses
- Properties of a theory: descriptive, rhetorical, inferential, application
- Atheoretical research: description, classification, prediction, observational studies generating hypotheses, grounded theory
The value of any theory is not ‘whether the theory or framework provides an objective representation of reality,’ but rather how well a theory can shape an object of study, highlighting relevant issues.
Concepts → Constructs → Variables → Relational Statements → Conceptual Model / Framework → Theory
1.9 Key Theoretical Frameworks
1.9.1 Distributed Cognition (Hutchins)
- Unit of analysis: socio-technical system
- Focus on process, representational states, and their meaning
- Major construct: propagation of representations through representational media
- Speed bugs example: moving task from individual cognition to property of system, transforming cognitive tasks into perceptual tasks, “does nothing to alter the memory of a pilot… reduces memory requirements”
- Clinical application: propagation from monitoring devices → EHR → paper summary → verbal presentation → written note → orders
- Cognitive artifacts and clinical decision support systems
1.9.2 Activity Theory
- Unit of analysis: a meaningful activity (defining at right level is critical)
- Focus on structure: subjects (actors), objects (objectives), community (social context)
- Relationships: rules, division of labor, mediating artifacts
- Well-named theoretical constructs (compared to distributed cognition)
1.9.3 Situation Awareness (Endsley)
- Perception → comprehension → projection in dynamic systems
- Another view: (Perceive → Comprehend → Project) → Decide → Perform
- You want to prevent people from getting hit in the head at the stadium? This theory can help you break down the problem.
1.9.4 Comparing Distributed Cognition and Activity Theory
- Rhetorical power: DiCog has few explicitly named constructs; AT has well-named constructs
- Focus: DiCog on socio-technical system; AT on individual
- Attention to process: DiCog central but implicit; AT built into representation
- Unit of analysis: DiCog = function of a system; AT = activity
1.9.5 Donabedian’s Quality of Health Care
- Structure → process → outcome
1.9.6 Technology Acceptance Model (Davis, 1986)
- Perceived usefulness, perceived ease of use → behavioral intention → actual use
1.9.7 Theory of Reasoned Action (Ajzen & Fishbein)
- You need intent + the ambient environment/social norms to effect behaviour (think vaccines and how these norms have shifted over time).
- Attitudes + subjective norms → behavioral intention → behavior
1.9.8 Theory of Planned Behavior
- Extends TRA with perceived behavioral control as third predictor.
- If you don’t believe X, you are very unlikely to engage. How do others view you when you don’t engage in behaviour. Self-efficacy (“it’s too hard”): even if you belive X, if you don’t have self-efficacy (“I can do this”) you will not engage in behaviour.
1.9.9 DeLone & McLean IS Success Model
- System quality, information quality, service quality → intention to use / use → user satisfaction → net benefits
- Application example: user satisfaction in Aims 1 & 2, information quality and system quality in Aim 3
1.9.10 Combining Theories
- Collins et al. example: combining Coiera’s model and Donabedian for EHR interdisciplinary information exchange of ICU common goals
1.9.11 Computer Supported Cooperative Work (CSCW) as a Framework (Pratt et al.)
- Focus: collaborative use of IT or collaboration through IT
- Levels of analysis: political (policy, guidelines), institutional (hospital), large groups (ward), small groups (patient care team)
- Key concepts: incentive structures (organizational – group – individual level), workflow (routine – exception), awareness (focus, nimbus, intersection)
1.9.12 Coiera’s Communication-Conversation Model
- Clinicians continue to rely on communication despite available information systems
- Continuum of communication and information tasks
- Common ground: knowledge shared by two communicating agents
- Grounding: acquisition of common ground necessary to accomplish a task
- Solid ground (established prior) vs. shifting ground (established on demand)
1.9.13 RE-AIM (Bakken & Ruland)
- Reach: absolute number, proportion, representativeness of participants; did program reach those most in need?
- Effectiveness: impact on outcomes, unintended adverse consequences, quality of life, cost
- Adoption: proportion and representativeness of settings and agents; did low-resource organizations serving high-risk populations use it?
- Implementation: agents’ fidelity to protocol, consistency of delivery, time and cost; how many staff delivered it?
- Maintenance: lasting effects at individual level, organizational sustainability over time, program evolution
1.10 Reviewing Literature
1.10.1 Why Review Literature
- When formulating research questions: overview of scholarship, examining significance, making sure research not done before
- Situating research in existing knowledge, clarifying contributions, identifying frameworks and methods
- Critiquing a selected work (journal/conference reviewer)
- Critiquing or re-examining evidence (systematic review, meta-analysis, meta-synthesis)
- Critiquing a proposal (review panel, external reviewer)
1.10.2 Searching the Literature
- Identify main concepts/keywords (research topics and methods)
- Develop a search strategy
- Select databases (cast a wide net, don’t limit to PubMed)
- Systematically record references (Zotero)
1.10.3 Levels of Reading
- Skimming: read titles, refine search, identify general clusters
- Comprehending: reading individual papers
- Analyzing: writing summaries
- Synthesizing: summarizing body of work, identifying gaps and opportunities
1.10.4 Reviewing Individual Papers
- Comprehend: identify problem, rationale, objectives, variables, design, sample, measurement, data collection, statistical analyses, interpretation; active reading (highlighters, notes, questions); write summary (description + assessment/implications/gaps)
- Assess: compare to ideal research process, identify strengths and weaknesses
- Analyze: examine logical links, consistency of implementation with goals, inferences; summarize conclusions, identify gaps
- Evaluate: determine meaning, significance, and validity
- Cluster: synthesize findings, relate to body of knowledge; reverse process (from paper → finding to finding → multiple papers) E.g. “Past research has provided robust evidence that well-developed problem-solving abilities are essential to successful diabetes management [Hill-Briggs, 2003, Paterson, 2000, Bonnet, 1998], result in better diabetes self-care behaviors [Cook, 2001, Glasgow, 1989, Toobert, 1991], and lead to improvements in clinical outcomes [Glasgow, 2007].”
1.10.5 Synthesizing Research Evidence
- Systematic review: identify, select, appraise, synthesize using systematic methods
- Meta-analysis: pooling results from several studies, statistical analysis on pooled data, computes effect size
- Integrative review: synthesis from variety of independent studies, can include qualitative, result is narrative
- Metasummary: qualitative, summing findings across reports in target area
- Metasynthesis: qualitative, uses original studies and metasummaries to produce synthesis
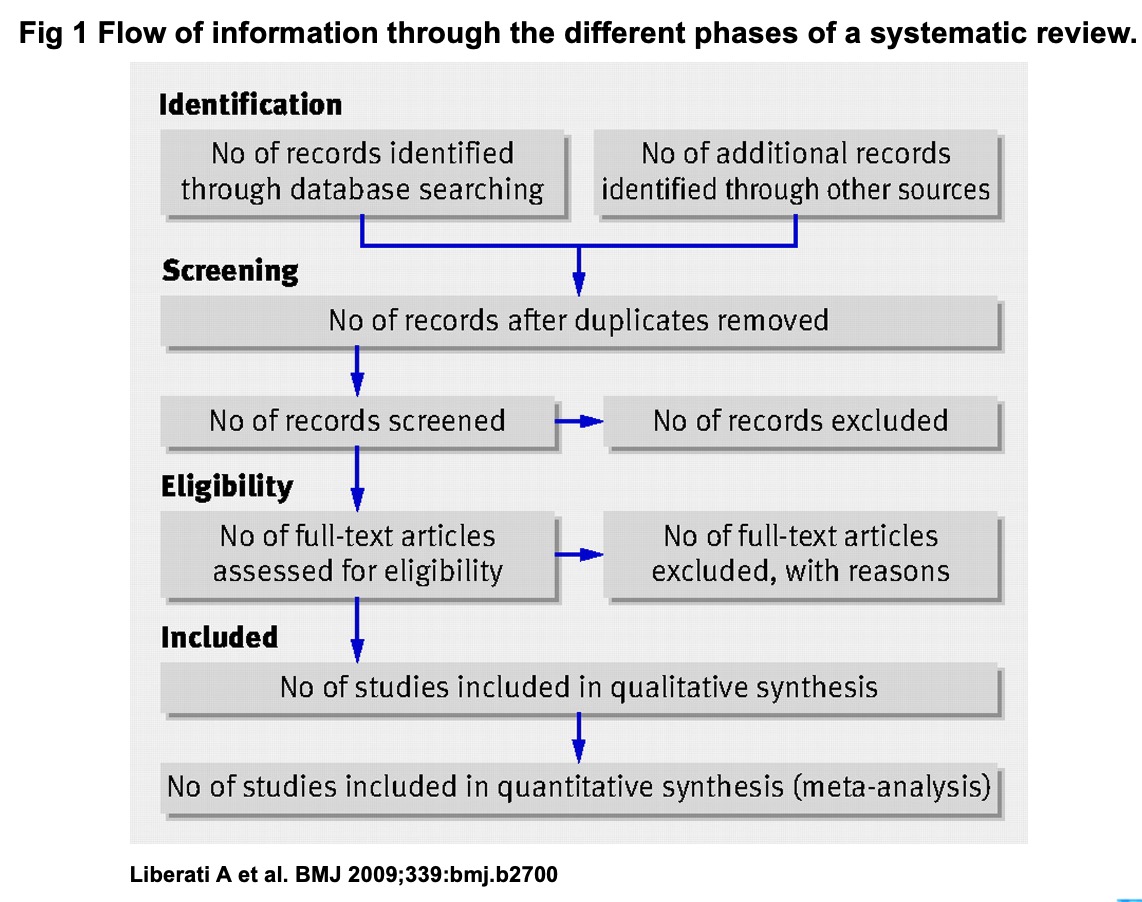
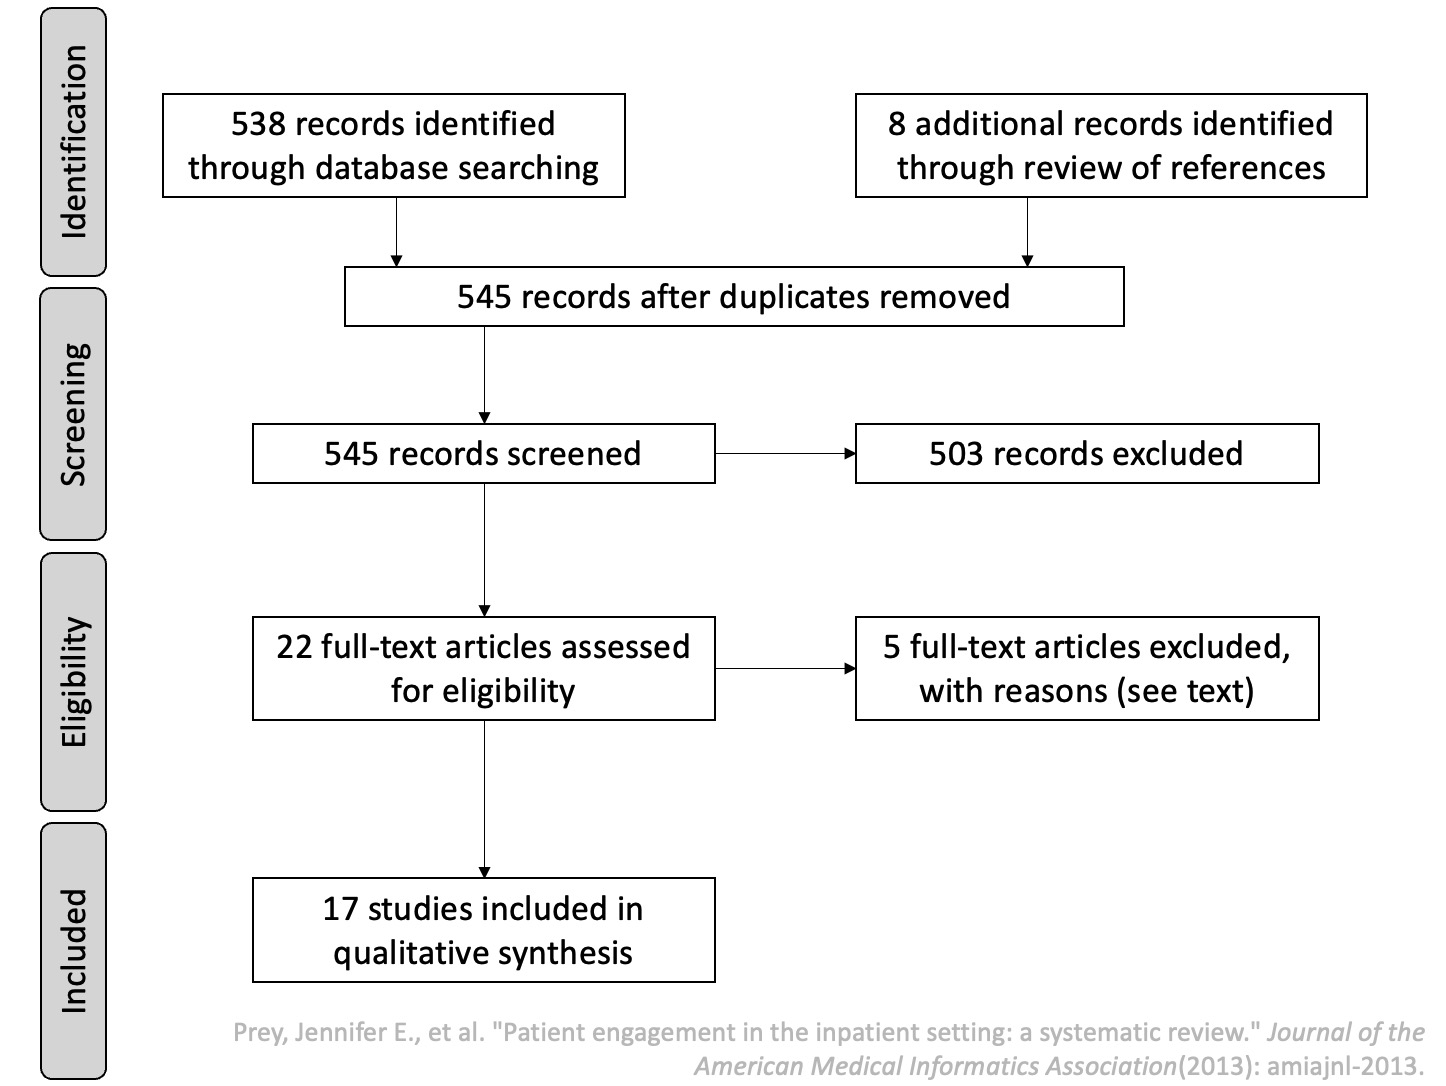
- PRISMA framework: planning (need for review, research questions, protocol) → conducting (identification, selection, quality assessment, data extraction, synthesis) → reporting (dissemination, formatting, evaluation)
Examples of Systematic Review.
1.11 Writing the Proposal: Question-Facing Sections
1.11.1 Why Write Proposals
- Formulate questions, articulate research plan (intrinsic benefits)
- Solicit feedback (reviews are most important part)
- Communicate plan to team (first activity: read the proposal)
- Obtain necessary resources
1.11.2 What Makes a Good Proposal
- Clearly articulates research goals and questions
- Communicates importance, gets reviewers excited
- Shows advancement of science (clear comparison with existing work)
- Well-articulated research plan with barriers and contingencies
1.11.3 Sources of Funding
- Government: NIH (NLM), NSF, AHRQ, PCORI
- Foundations: RWJ, Hartford, MacArthur; RFAs, general or by invitation
- Corporate: tech companies, drug companies, less formal, can affect scientific goals
- Intramural: smallest (~$20–40K), fastest, often pilot studies leading to external funding
- Funding agency priorities: NIH (significance, innovation, approach, preliminary results), NSF (intellectual merit, broader impact, transformative research, students), AHRQ (comparative effectiveness, quality, safety), PCORI (patient-centered outcomes)
1.11.4 NIH Structure
- $48.7 billion annual budget (2026), 21 institutes
- National Library of Medicine funds most informatics innovation
- Types: R21 (exploratory, up to 2 years, no preliminary data required), R01 (main grant), R18 (translational), K awards (career development like K22, RO3.)
- RFA (targeted) vs. unsolicited
1.11.5 SF424 Application Structure
- Face page, description/abstract, budget, biographical sketch, resources, research plan, appendix, checklist
1.11.6 Specific Aims (1 page)
- First paragraph: opportunity, challenge, status, change in environment
- One sentence on what you will do
- Numbered aims with hypotheses (1–3 sentences each)
1.11.7 Significance (1–2 pages)
- Why is the question important, who benefits, what answers will the study provide
- Organize: why is the problem a problem → what has been done → challenges → what else warranted → what needs to be known now
1.11.8 Innovation (1–3 pages)
- New ideas (challenges/shifts paradigms), new models (novel concepts/approaches), new applications (refinements/improvements)
- Determine what is novel, describe status quo, describe what is NOT being done, position your proposal
2. Research Question → Study Plan
2.1 Basic Research Components
- Research questions: what to study
- Research design: how to study
- Subjects: who to study with
- Variables: what can be captured and how
- Analysis: increasing confidence in findings
2.2 Important Design Considerations
- Research goal: exploration, hypothesis testing/evaluation, theory testing
- Measurement vs. demonstration study
- Data type: qualitative vs. quantitative
- Data collection: observation vs. experiment
2.3 Quantitative Study Design
2.3.1 Observational vs. Experimental
- Observational: observing the world without introducing change; descriptive (characteristics of population) and analytic (associations through comparisons)
- Experimental: investigator controls the independent variable, observes outcomes; potential to infer causality
2.3.2 Temporal Orientation
- Retrospective: uses available/existing data, inexpensive
- Prospective: can control data collected (definition, completeness, quality)
2.3.3 Cross-Sectional Studies
- Single point in time, all measurements within short period, no follow-up
- Prevalence not incidence; if measured at intervals can observe trends
- Best for measuring associations; cause and effect by hypothesis only
- Informatics example: clinicians surveyed on documentation practices (Smart Paste vs. copy-and-paste); inverse association found but direction ambiguous
- Analysis: frequency of occurrence, prevalence
- Strengths: fast, inexpensive, no loss to follow-up
- Weaknesses: cannot establish causal relationships, impractical for rare diseases
2.3.4 Cohort Studies
- Subjects selected based on exposure, followed over time
- Cohort studies start with a cross-sectional study (eliminate subjects who already have outcome)
Prospective Cohort
- Begins at point of exposure, follows forward
- Informatics example: electronic handoff tool available to all clinicians, some adopt (exposure), compare antibiotic prescribing appropriateness after 6 months
- Strengths: assesses incidence, investigates potential causes, measures variables more completely
- Weaknesses: cannot assume causality, expensive, inefficient for rare outcomes
Retrospective Cohort
- Assembly, baseline, and follow-up already happened; uses existing data
- Strengths: assesses incidence, inexpensive
- Weaknesses: limited control over sampling and data quality
Multiple/Double Cohort
- Separate cohorts with different exposure levels
- Strengths: may be only feasible approach for rare exposures (occupational/environmental hazards)
- Weaknesses: cohorts from different populations, increased confounding
2.3.5 Case-Control Studies
- Subjects recruited based on outcome (dependent variable), retrospective
- Informatics example: clinicians selected by antibiotic prescribing appropriateness, examine handoff tool use
- Strengths: very efficient for rare outcomes, short duration, small sample, useful for hypothesis generation
- Weaknesses: sampling bias, retrospective measurement, limited to one outcome
- Control sampling strategies: hospital/clinic-based, population-based, matching, two or more control groups
2.3.6 Nested Designs
Nested Case-Control
- Cases drawn from predefined cohort after follow-up
- Strengths: choose post-outcome whom to measure, useful for expensive predictor variables (archived charts), avoids biases of different populations
- Weaknesses: not all predictors assessable post-outcome, no advantage for inexpensive measurements
Nested Case-Cohort
- Controls are random sample of entire cohort regardless of outcome
- Additional strengths: controls represent cohort (estimate incidence/prevalence), reusable comparison group for multiple outcomes
2.3.7 Case-Crossover Design
- Each case serves as own control, comparing exposures at time of outcome vs. other time periods
- Strengths: useful for short-term effects of intermittent exposures, limits bias from different populations
- Weaknesses: not applicable to all predictor/outcome types
2.3.8 Classic Epidemiology Table
- 2×2: exposed/not exposed × positive/negative outcome (A, B, C, D)
2.3.9 Types of Demonstration Studies
- Descriptive: estimate dependent variables
- Comparative: compare performance
- Correlational: effect of independent on dependent without manipulation
2.3.10 Measurement Study
- How much error can you measure an attribute with?
- Tells us how accurate demonstration study will be
- For new measures, need measurement study to quantify error
- For old measures, may need to repeat for new context
- Objectives: determine sample size, verify instrument accuracy, test in different contexts
2.4 Experimental and Quasi-Experimental Designs
2.4.1 Randomized Controlled Trial
- Subjects randomly assigned to intervention or control
- Control receives standard of care (equivalence trial)
- Strengths: not biased, can infer causality
- Weaknesses: expensive, limited to variable of interest, can cause adverse effects
2.4.2 Designing an RCT
- Intervention/control: what to study, intensity/dose, duration, frequency; control may require placebo for blinding
- Outcome measurements: Level 1 (clinical outcomes), Level 2 (intermediate markers), Level 3 (processes); adverse/unanticipated effects; continuous vs. dichotomous; single primary endpoint; time to measure
- Diabetes outcome example: 6 months–1 year (HbA1c measurement), 1–2 years (decrease in HbA1c), 2–3 years (decrease in complications), 3–5 years (decrease in mortality)
- Selecting participants: maximize power, reduce confounders, maximize benefit, generalize broadly; stratification; exclusion reasons (harmful, unlikely effective, likely dropout, practical problems)
- Problem of limiting entry criteria: comorbid conditions (48% Medicare beneficiaries had 3+ conditions)
- Baseline variables: describe participants (generalizability), subgroups for secondary analysis, baseline value of outcome variable (“pre-test”), biobanking
- Randomizing: addresses bias during assignment, ensures equal distribution; block randomization, stratified block, randomizing matched pairs
- Blinding: addresses bias during intervention and ascertainment; double-blinding (neither patient nor caregivers know assignment); in informatics often not possible; must blind outcome measurement staff
- RCT with run-in period: tests compliance before randomization
2.4.3 Cluster Randomized Trial
- Assignment at group level rather than individual
- Strengths: decreases cross-contamination, more efficient implementation
- Weaknesses: decreased power (effective sample size between number of clusters and participants)
2.4.4 Factorial Design
- Multiple interventions, groups divided by combinations
- Strengths: answers multiple questions within single cohort, more efficient than RCT
- Weaknesses: possible interaction among interventions
2.4.5 Crossover Design
- Two groups, each acts as control and intervention in different order
- Strengths: between-group and within-group analyses, concurrent controls, minimizes confounding
- Weaknesses: longer study (washout period), complexity of analysis, carryover effects
2.4.6 Quasi-Experimental Designs (non-randomized)
- Pre-post design with concurrent controls (most commonly used)
- Time-series design: subjects as own controls; strengths (innate characteristics eliminated); weaknesses (no concurrent controls, learning effects, regression to mean, secular trends)
- Posttest only with controls: when dependent variable cannot be measured before treatment
- Removed treatment design: single group, times treatment removal, periods between measures must be equal
- Double pretest pre-post: observe underlying trend, shortened interrupted time-series
- Pre-post design: very common, one of the weakest (regression to mean)
- Posttest only: pre-experimental, must know a great deal about causal factors
2.4.7 Relative Authority of Designs (highest to lowest)
- RCT → factorial → cluster randomized → time series → crossover → pre-post with controls → posttest only with controls → removed treatment → double-pretest pre-post → pre-post → posttest only
2.4.8 Control Strategies
- No control, no pre-test: descriptive (uncontrolled), cannot draw conclusions
- No control, can do pre-test: historically controlled (pre-post); increase authority with external control, removed treatment, multiple observations
- Control but cannot randomize, no pre-test: posttest only with controls; increase authority by collecting comparative data
- Control, pre-test, cannot randomize: pre-post with concurrent controls; increase authority with comparative data
- Randomized: purpose is group different only in intervention; eliminates bias from unknown factors; simultaneous randomized controls; crossover; randomize within blocks; complete factorial
2.4.9 Using Existing Databases
- Strengths: secondary analysis, inexpensive, fast, large groups
- Weaknesses: retrospective even if data collected prospectively (exception: clinical trial management systems)
- Examples: gene identification, genotype-phenotype linkages, cancer registries, association mining, outcome studies
2.4.10 Advanced Experimental Designs
- Micro-randomized trials (Klasnja et al.)
- SMART: sequential, multiple assignment, randomized trial (Collins et al.)
2.5 Qualitative Research Design
2.5.1 Why Qualitative Methods
- Exploratory: identify and refine questions, understand opportunities for innovation
- Evaluation: understand why informatics innovations used or not, what contributes to effectiveness
- Real work practices are complex, happen in complex contexts (organization, culture, personal motivations)
- Any design imposes new organization of work: possibility of mismatch, lack of adoption, errors, workarounds
- Focus on rich description (thick description), interpretation
2.5.2 Historical Roots
- Anthropology: armchair anthropology → fieldwork; Bronislaw Malinowski (Western Pacific), Franz Boas (Inuit), Margaret Mead (South Pacific/SE Asia, women in field)
- Sociology: Chicago school; Robert Park (journalist, urban poor, opium addiction, reform), Everett Hughes (non-dispossessed: medical, police, school teachers)
2.5.3 Designing Qualitative Studies
- Who: identifying stakeholders, sampling (snowball), users vs. stakeholders, gatekeepers, securing cooperation, ethics
- Where: context is key, cultural and environmental constraints, habitual environments provide clues
- How: selecting methods — habitual work practices → observations; motives/attitudes/perspectives → interviews; hybrid → surveys, time-and-motion, work sampling
2.5.4 Researcher Role
- Tabula rasa, defamiliarization
- Master-apprentice model
- Design intuitions
- Examining biases (previous experience)
- Going native: losing objectivity
- How to introduce the study, build rapport, define role (“fly on the wall”)
- What to pay attention to: start broad, gradually focus, periodically re-examine
2.5.5 Qualitative Data Collection
Observations
- Participant vs. non-participant observation
- Recording: jotting notes, expanding within 2 hours, create narrative from keywords (these are your only data! Account for memory loss!)
- Challenges: missing critical stakeholders, missing critical aspects, too broad or narrowing too quickly, sparse notes, going native, Hawthorne effect
- Strategies: time (they get used to presence), build rapport, triangulate
Interviews
- Structured (survey), unstructured (ethnographic), semi-structured (qualitative)
- Purpose: in-depth responses on experiences, perceptions, opinions, feelings, knowledge; data consist of verbatim quotations with sufficient context
- Unstructured: no guide, conversation form, chain of associations; use very early when not sure what/how to ask
- Semi-structured: interview guide (broad areas with probing questions); guide is a guide not prescription; open with initial questions, pursue interesting themes, return to guide if conversation lags
- Grand tour question: first question, sets tone, easy to answer (not yes/no), starts conversation
- Master-apprentice model vs. interviewer-interviewee model
- Probing: “tell me more,” “why do you say that,” encourage to continue, silent technique, echo technique, agreeing sounds
- Avoid: leading questions, abstract questions/summaries (summarizing is your job)
- Challenges: quiet interviewee, politically charged topics, emotional subjects, challenging expertise
Surveys
- Why: reach wide audience, quantify/assess proportions/scale/extend
- When: not good for discovery (start with qualitative), great for confirming findings with larger numbers
- Question design: avoid ambiguity, avoid leading questions; ask yourself: do I need to know? How much detail?
- Always pilot
Artifacts
- Hand-written notes, forms, guidelines, reference materials, pictures
- Often discarded at end of shift — ask to collect
- Example: handoff communication forms (unique per team member, analyzed headers for cross-disciplinary content)
Other Methods
- Written discourse (clinical notes), recording naturally occurring discourse (handoff)
2.6 Design of Informatics Interventions
2.6.1 Steps in Interventions Research
- Identify general problem space → describe problem space → formulate research questions → design solution/intervention → evaluate intervention → formulate new questions → design study plan → refine questions
2.6.2 What Is Design
- “The ability to imagine that-which-does-not-yet-exist, and to make it appear in concrete form” (Nelson & Stolterman)
- “Making decisions, often in the face of uncertainty” (Zinter)
- “Everyone designs who devises courses of action aimed at changing existing situations into preferred ones” (Simon)
- “Designing is to initiate change in man-made things” (Jones); revision: “thoughts and actions intended to change thoughts and actions”
Some state —→ Transformation Function —→ Desired State.
2.6.3 What Makes Design Challenging
- Must predict future states and specify actions to bring them about
- Cannot know unintended consequences in advance (Nelson & Stolterman)
2.6.4 Some Transformation Functions
John Chris Johns (1970) proposed three steps for that Transformation Function.
- Analysis: Understand current state of World. Break into pieces.
- Synthesis: Put pieces together in a different way
- Evaluation: Did it work?
Ogilvie and Liedtka (2011) have a different process:
- Discover: What is?
- Ideate: What if?
- Embodiment: What wows?
- Develop: What works?
- Evaluate: Did it work?
2.6.5 Contextual Design (Discover Phase)
- Using collected data to develop conceptual account of work
- Using language to focus thought, graphical language for seeing important aspects
- Identify problems, bottlenecks, gaps, inefficiencies
- Different from purely qualitative research: synergy between problems and solutions
Work Models
- Flow model: individuals (roles, responsibilities), groups, information flow, artifacts, communication topics, places, breakdowns
- Sequence model: intent, trigger, steps, orders/loops/branches, breakdowns; compare individual sequences to generalize
- Artifact model: information, parts, structure, annotations, presentation, conceptual distinctions, usage, breakdowns
- Cultural model: influencers, extent of effect, direction of influence, breakdowns
- Physical model: places, structures, tools, artifacts, layout, breakdowns
Process
- Interpretation sessions: room, whiteboard, post-its, team roles (interviewer, work modelers, recorder, moderator)
- Consolidation: comparing individual models, looking for similarities and patterns, developing consolidated models, sharing with users (member checks)
- Affinity diagram: organizing individual notes into hierarchy revealing common issues and themes
Work Redesign
- Flow model: role switching, role strain/bottlenecks, role sharing; can roles be consolidated/automated/linked?
- Sequence model: focus on intents rather than actions; can intent be met with automation? Unnecessary steps? Better triggers?
- Re-create models with improvements, discuss with stakeholders, use as guidance for UI design
2.6.6 Ideation Techniques
- Analogical thinking, attribute listing, brainstorming, case-based reasoning, forced connections
- IDEO cards, lateral thinking, morphological analysis
- SCAMPER (substitute, combine, adapt, modify, put to other purposes, eliminate, rearrange)
- SIT (unification, multiplication, division, breaking symmetry, object removal)
- Synectics, TRIZ, Whack Pack
2.6.7 Human vs. Computer Capabilities
- People: creative tasks, open-ended tasks, hands/eyes/ears, physical/digital media, finding patterns, interpreting fuzzy data, ambiguity, context, emotion
- Computing: perfect memory, fast calculations, large data processing, consistent repetition, non-destructive editing (undo, layers, version control)
2.6.8 Design Embodiments
- User stories/scenarios: plain language descriptions of interaction (goals, expectations, actions, reactions); appropriate detail for design stage; create alternatives; consider errors and worst-case
- Storyboards: comic strip narratives of important interaction aspects; borrowed from movie industry; particularly useful for scenarios difficult to describe in words
- Prototypes/mockups: choose fidelity (low → high); low cost = low barrier to change; users react to concepts not rendering
- Wireframes: structural layout
- Wizard of Oz: human operator behind the curtain manipulates input/output; avoids investing in complex functionality
- Participatory design
- Tools: InVision, Silk/DENIM, hand-drawn
2.7 Writing the Proposal: Design-Facing Sections
2.7.1 Approach
- Preliminary studies: current setting, investigator qualifications, relevant prior work; summarize significance
- Define framework
- Detailed plan per aim: development, implementation, evaluation
- Evaluation: research questions, design type, measurements (including population summary statistics), statistical tests, confirmatory hypotheses, exploratory hypotheses, power calculations
- Privacy and security: data sources, recruitment table, risks, IRB, HIPAA, data storage/transfer
- Risk mitigation / limitations
- Dissemination: papers, other methods, future proposals
- Timeline
2.8 Sampling
2.8.1 From Population to Sample
- Population → target population → accessible population → sample → subject
- Sampling criteria: inclusion/exclusion; broad → heterogeneous, specific → homogeneous
- Representativeness: demonstrated with comparisons to population parameters
2.8.2 Random Sampling Methods
- Simple random sampling
- Stratified random sampling (within strata based on characteristic of interest)
- Cluster sampling (naturally occurring clusters, e.g., hospital wards)
- Systematic sampling (ordered list of population)
2.8.3 Nonrandom Sampling Methods
- Convenience sampling (meet criteria, easily accessed)
- Consecutive sampling (recruited one after another)
- Purposive sampling (qualitative)
- Network/snowball sampling (qualitative)
- Theoretical sampling (grounded theory)
2.8.4 Randomization
- “Random sampling” selects patients randomly
- If randomly selected → “control group”; if not → “comparison group”
2.8.5 Sampling Frames and Plans
- Sampling frame: listing members available for selection, with count
- Sampling plan: strategy following a sampling method
2.8.6 What Can Go Wrong
- Accidental over-recruiting within a characteristic
- Non-response (contributes to bias)
- Insufficient number of participants
3. Study Plan → Actual Study
3.1 Variables
3.1.1 From Questions to Variables
- Conceptualization: defining main concepts (clear, precise — what is included and excluded)
- Operationalization: identifying indicators, how observed and measured
3.1.2 Types of Observability
- Direct observables: captured by direct observation (number of information exchanges during rounds)
- Indirect observables: captured through indirect means (informal exchanges outside rounds)
- Constructs: cannot be captured directly or indirectly (satisfaction) — require proxy measures
3.1.3 Variable Roles
- Predictor (independent): what you are manipulating
- Outcome (dependent): what you are measuring as result
- Confounding: extraneous variables not manipulated but potentially impacting outcome
3.2 Measurement Types
- Nominal/categorical: names or categories, no order (city names)
- Ordinal: ordered but distance unknown (Likert scales)
- Interval: numerical, equal intervals, zero has no meaning (Fahrenheit)
- Ratio: interval with meaningful zero (weight, Kelvin)
- Information content hierarchy: nominal (lowest) → ordinal → interval → ratio (highest)
- Parametric tests for interval/ratio; non-parametric for nominal/ordinal
3.3 Measurement Validity (Test Validity)
- Content validity: how well instrument captures ALL aspects of phenomenon
- Face validity: whether instrument seems inherently reasonable to experts
- Construct validity: extent to which operationalization represents the actual construct; convergent validity (expected correlations exist), discriminant validity (expected non-relationships hold)
- Predictive validity: degree to which measure predicts future outcomes
- Criterion-related validity: correlation with external standard (>.4 required), concurrent validity (correlates at same time)
3.4 Qualitative Data Collection in the Field
- Notes from observations, transcripts/notes from interviews, artifacts, photographs/sketches.
3.5 Research Data Management
3.5.1 Data Tables
- Simple single table (rows = participants, columns = variables)
- Longitudinal data: long format (multiple rows per participant), multiple tables
- Normalization: breaking into multiple tables, each with primary key
3.5.2 Research Identifiers
- Breach of confidentiality is significant risk
- Assign unique meaningless identifier, store key separately in password-protected file
3.5.3 Types of Research Databases
- Spreadsheets (Excel, OpenOffice, Google): easy to create, well-suited for simple studies
- Flat files: good for unstructured data, intermediate format, eventually converted
- Relational database systems (MySQL, DB2, Oracle, Sybase, SQL Server): well-suited for complex projects
- REDCap: allows quick online surveys, addresses HIPAA/security, CTSA license for CUIMC, support for multiple study designs
3.5.4 Data Dictionaries
- Explicit definitions of variable names (field name, data type, description)
- Critical for multi-year projects with changing personnel
- Metadata: data about data
3.5.5 Common Data Elements
- Standard format shareable between projects
- Enable comparison across studies, systematic reviews, meta-analyses
- Sometimes required by funders (NINR requires PROMIS measures)
3.5.6 Data Entry
- Keyboard transcription: paper → electronic; advantages (paper backup); disadvantages (no data checking, transcription error)
- Distributed data entry: multi-center; training, manuals, synchronization, security
- Electronic data capture: direct digital entry; advantages (reduce error, validation, skip logic, mobile); disadvantages (technology dependence, wifi, challenging populations)
- Coded responses vs. free text: coded preferred; exhaustive and mutually exclusive options; “all that apply,” “other,” “not applicable”; pilot to identify options; training of coders
3.5.7 Data Processing
- Convert to analysis format (single table for quantitative, master file for qualitative coding)
- Data cleaning: aligning timelines, removing duplicates/invalid entries
- Incomplete data: imputing (random vs. non-random missingness)
3.5.8 Data Security
- De-identification with separate identifiers
- Transfer: MUST be encrypted, no email unless encrypted within institution
- Access: document who has access, reassess annually
- Storage: laptops, USB drives
4. Actual Study → Findings
4.1 Descriptive/Exploratory Statistics
- Point estimates: mean, median, mode
- Interval estimates: confidence interval (must accompany point estimates)
- Measures of dispersion: range, variance, standard deviation
- Data distribution: symmetry/skewness, modality
- Histograms/density plots
4.2 Quantitative Outcome Measures
- Risk: probability of outcome given exposure (N with outcome / N exposed)
- Odds: likelihood of outcome vs. no outcome (N with outcome / N without)
- Rates: events accumulated over time (N with outcome / person-time exposed)
- Prevalence (cross-sectional) vs. incidence (cohort)
4.3 Qualitative Data Analysis
4.3.1 General Process
- Fieldwork produces volumes of data (examples: 200+ hours audio, 50+ field notes, 100+ recorded handoffs)
- Convert all data to text → identify major themes → illustrative case studies
- Analysis begins before data collection and continues through writing
- Three common elements: data reduction, data organization, data explanation/verification
- Four kinds: qualitative analysis of qualitative data (focus), qualitative of quantitative, quantitative of qualitative, quantitative of quantitative
4.3.2 Grounded Theory (Glaser & Strauss)
- Goal: develop a theory from qualitative data
- Theoretical sensitivity: review existing theories to focus investigation
- Open coding: breaking down, examining, comparing, conceptualizing, categorizing; labeling phenomena, discovering categories, developing properties and dimensions
- Open coding example: diabetes app interview → code “prompted reflection”
- Axial coding: reviewing and consolidating categories; for each category: causal conditions, intervening conditions, action/interaction strategies, consequences
- Axial coding example: codes → category “cognitive apprenticeship” (properties: analytical, self-driven; dimensions: guided–independent)
- Selective coding: selecting core category, explicating story line, relating other categories to core, validating; commitment (there can only be one)
- Selective coding example: cognitive apprenticeship selected → educator demonstrates → patient practices → patient demonstrates mastery
- Grounded theory is time-consuming, requires analytic commitment; transition from theory to design not obvious; many who claim GT used the methods but did not arrive at a theory
4.3.3 Thematic Analysis (Braun & Clarke)
- Similar to grounded theory but without theoretical commitment
- Focus on identifying recurrent themes — patterns of meaning — through interpretative analysis
- Themes do not emerge; they are synthesized by researchers
- What is a theme: patterned response to a research question; not about frequency but significance in relation to question
- Focus: broad overview vs. focused examination
- Approach: inductive (data → themes, exploratory) vs. deductive (theory → data categories, theory-driven)
- Level: semantic (descriptive) vs. latent (underlying ideas, interpretive)
- Six steps: familiarizing → generating initial codes → searching for themes → reviewing themes (Level 1: coded extracts; Level 2: entire data set, thematic map) → defining and naming themes → producing the report
4.3.4 Writing Qualitative Results
- Present main findings (themes or overarching theory)
- From quotes to concepts: illustrate with quotes, balance quotes and interpretations
- Quotes are for illustration not replacement (analytic narrative)
- Forms: narrative/thick description, conceptual framework
4.3.5 Tools
- Low-tech: hand-written comments on printed transcripts, posted notes, affinity diagrams
- High-tech: Excel, NVivo
4.4 Translational Research Stages
| Stage | Direction | Description | Typical Methods / Studies |
|---|---|---|---|
| T1 | Laboratory → Clinical Practice | ”Bench to bedside” | Case studies, Phase 1–2 trials |
| T2 | Clinical Studies → Populations | ”Research to practice” | Observational studies, Phase 3–4 trials |
| T3 | General Populations → General Practice | Dissemination and implementation | Implementation research |
| T4 | Application → Real-World Outcomes | ”Practice to impact” | Policy research |
Clinical Trial Phases
| Phase | Purpose / Focus | Description |
|---|---|---|
| Phase 0 | Exploratory, first-in-human | Early, small-dose studies to assess pharmacokinetics and feasibility |
| Phase 1 | Safety, tolerability | Determines safe dosage range and identifies side effects |
| Phase 2 | Efficacy | Evaluates effectiveness and further assesses safety |
| Phase 3 | Multi-center, effectiveness | Confirms effectiveness, monitors adverse reactions, compares to standard treatments |
| Phase 4 | Post-marketing surveillance | Tracks long-term effects and real-world safety after approval |
5. Findings → Truth in Study
This is about Internal Validity
5.1 The Inference Model
- Design and implementation connect questions to findings
- Drawing conclusions: infer from findings back to truth
- Internal validity: are conclusions valid within the setting of the study?
5.2 Precision, Accuracy, and Validity
- Precision (reliability): reproducibility, consistency
- Accuracy: deviation from target
- Validity: adds qualitative dimension to precision and accuracy; addresses factors contributing to trustworthiness
- Diagrams: not precise / precise but not accurate / precise and accurate
5.3 Bias
- Degree to which estimate differs from target
- Easier to estimate direction than magnitude (toward the null, away from the null, switchover)
- Can still decide if conclusion is correct
5.4 Types of Error
- Random error: due to chance, equally likely distortion in either direction, impacts precision; solution: increase sample size
- Systematic error/bias: distortion in specific direction, impacts accuracy
5.5 Hypothesis Testing
5.5.1 Process
- Before study: state hypothesis, state decision rule, state assumptions
- Study: collect data
- After study: describe data (descriptive statistics), review assumptions, select test statistic, calculate, make statistical decision (reject or fail to reject null), make conclusions
5.5.2 P-Value
- Probability of results at least as extreme as observed, assuming null hypothesis is correct
- Lower p-value → lower probability results are due to chance
5.5.3 Choosing Right Measures and Tests
- Measure must be good predictor of phenomenon; use standardized/well-accepted measures
- Assumptions about distribution (normal or not)
- Data format of predictor and outcome variables
- Statistical test selection table (Glanz): scale of measurement × study design → appropriate test
- Interval: unpaired t-test, ANOVA, paired t-test, repeated-measures ANOVA, linear regression / Pearson correlation
- Nominal: chi-square, McNemar’s test, Cochrane Q, contingency coefficient
- Ordinal: Mann-Whitney, Kruskal-Wallis, Wilcoxon signed-rank, Friedman, Spearman rank correlation
- Survival time: log-rank test / Gehan’s test
5.5.4 Specific Statistical Methods
Pearson’s Correlation Coefficient
- Measure of correlation between two continuous normally distributed variables
- r value between -1 and +1
- Calculating: covariance of variables / product of standard deviations
- Test of significance: follows Student’s t-distribution with df = n-2
- Assumptions: continuous, normally distributed, linear relationship
Spearman’s Rank Correlation
- Non-parametric: when Pearson’s assumptions not met
- Determines strength and direction of monotonic relationship
Linear Regression
- Predict scores on Y from scores on X
- Best-fitting line minimizing sum of squared errors
- Y’ = bX + A (predicted score = slope × X + intercept)
- Assumptions: independent observations, linear relationship, no perfect multicollinearity, normally distributed residuals, constant variance (homoscedasticity)
Chi-Square
- Examines relationship between two categorical variables
- Test whether outcomes occur in equal frequencies or conform to known distribution
- Calculating: observed vs. expected values, df = (rows-1)(columns-1)
- Cohen’s kappa: commonly used in qualitative research for inter-rater reliability
- Odds ratio
Independent Sample t-test
- Test of difference between two groups
- One dichotomous independent variable, one continuous dependent variable
- Comparing difference in means to pooled standard deviation
Paired t-test
- Pairs of measures, often pre-post (same subjects measured twice)
McNemar’s Test
- For categorical (nominal) data in 2×2 table
Analysis of Variance (ANOVA)
- Generalized t-test for more than 2 groups
- If within-group variance < between-group variance, groups are different
- F statistic (Sir Ronald Fisher)
- Types: one-way (one predictor), factorial (several predictors), repeated-measures (across time points)
Degrees of Freedom
- Number of values free to vary in final calculation
- William Sealy Gosset (“Student”)
One vs. Two Tailed Tests
- Two-tailed preferred (more conservative)
5.5.5 Type I and Type II Errors
- Type I (α): reject null when association not present (false positive); can result from insufficient specificity, incorrect decision rule, overestimated effect size
- Type II (β): fail to reject null when association present (false negative); can result from insufficient sensitivity, small sample (underpowered)
- Power (1-β): probability of correctly rejecting false null hypothesis
5.5.6 Multiple Comparisons
- Multiple hypotheses increase likelihood of significance by chance
- Adjust: Bonferroni (divide significance by number of hypotheses)
- Importance of stating hypotheses before analysis
- Shift toward reporting confidence intervals in addition to p-values
5.5.7 Power Analysis
- Parameters: significance level (α), sample size, effect size, power (1-β); if three known, fourth can be computed
- Conventional values: α usually 0.05 (range 0.01–0.1); power usually 0.80 (range 0.80–0.95)
- Effect size: degree to which phenomenon present in population; small ( 0.3), medium (0.3–0.5), large ( 0.5)
- Sources of effect size (descending): meta-analysis, previous studies, pilot studies, smallest clinically meaningful value
- Parametric tests more powerful than non-parametric; chi-square weakest
- Sample size vs. power: too small → results appear important but not significant; too large → significant but not interesting
- Steps: state hypotheses, select test, choose effect size, set α and β, use table/equation/website
- Worked examples: t-test (FEV1 in asthma, N=394), chi-square (Tai Chi vs. jogging back pain, N=313 per group), correlation (cotinine and bone density, N=113)
- Fixed sample sizes: work backward to estimate detectable effect size
- Maximizing power: use continuous variables, paired measurements, more precise variables, more common outcome
5.6 Threats to Internal Validity
- Confounding: causal link between DV, IV, and third variable (do matches cause lung cancer?); strategy: identify multiple alternative hypotheses, exploratory studies
- Selection bias: pre-existing differences between study populations, difference between volunteers and non-volunteers; strategy: randomization
- History: uncontrolled events during study (newspaper article, COVID-19); strategy: randomization, external control
- Maturation: subjects change views over time (longitudinal studies of depression in chronic disease); strategy: randomization, repeated measures, trending
- Testing: interaction of test and outcome, subjects learn from test; strategy: pilot study, Solomon four-group design
- Regression toward the mean: subjects selected on recent extreme values most likely to be closer to mean next time; strategy: trend data
- Assessment bias: investigator allows feelings/beliefs to bias results (champions vs. skeptics); strategy: blind all staff collecting data/judgments
5.7 Internal Validity Implementation Effects
- Hawthorne effect: employees changed behavior because they were subjects (Western Electric, late 1920s); strategy: balanced incomplete block design
- Checklist effect: more complete, better-structured data leads to better decisions (appendectomy in ER); strategy: collect data on both groups
- Data completeness effect: system may find more errors as well as prevent them; strategy: collect same data on all, pilot to measure difference
- Feedback effect: feedback and auditing may improve performance; strategy: same feedback in both groups, third feedback-only group
- Carryover effect: effect spreads from intervention to control (subjects remember advice, physicians share); strategy: crossover design, nesting
- Placebo effect: patient belief improves measures (seeing physician use computer); strategy: make groups equivalent
- Second-look bias: subjects give better answers on second try; strategy: increase interval, let control assess twice, use different cases
5.8 Rigor in Qualitative Research
- Validity: does research measure what intended?
- Reliability: consistency over time, reproducibility
- Generalizability: results applicable to other populations
- Holistic fallacy: researcher becomes increasingly certain conclusions are correct
- Safeguards: triangulation, member checking, neutral partner, saturation, audit trail
- Reflexivity: examining own assumptions, biases, values, attitudes, feelings
- Validity checking: know yourself, know your question, seek creative abundance, be flexible, exhaust data, avoid premature/delayed closure, celebrate anomalies, get critical feedback, be explicit
6. Truth in Study → Truth in Universe (External Validity)
6.1 External Validity
- Can conclusions be applied in other settings?
- Can others benefit from results?
6.2 Threats to External Validity
- Developers evaluating own resource: bias, poor generalization (many NLP studies); strategy: separate evaluation team
- System modification: “fixing” bugs during evaluation causing other problems; strategy: freeze system during evaluation, define requirements with initial evaluation
- Generalizing from the sample: careful when generalizing beyond actual study population; strategy: choose cases representing population of interest
- Selection of tasks, subjects, judges: be as representative as possible (single vs. multi-center trial)
- Evaluation paradox: need to use system to prove it works, but won’t use unproven system; use during study doesn’t reflect future use
- Intention to treat: subjects switching groups exaggerates usefulness; strategy: analyze by assigned group not behavior group (mimics real use)
6.3 Sources of Authority
- . Evidence uber alles.
- Design, implementation, and analysis all affect validity
- Must balance validity with practical limitations
6.4 Critiquing a Quantitative Study
- Identify statistical procedures used
- Judge whether procedures appropriate
- Comprehend discussion of results
- Judge whether interpretation appropriate
- Evaluate clinical significance of findings
7. Evaluation of Informatics Interventions
7.1 Purposes of Evaluation
- Assess efficacy/effectiveness: when intervention completed, generate evidence for impact
- Refine design: during design process, less about evidence, more about improving
7.2 When to Evaluate
- As early and as frequently as possible: redesigned work models, user stories, low-fidelity prototypes, high-fidelity prototypes
7.3 Design Critiques
- Informal meeting (3–7 diverse participants)
- Goals: compare approaches, discuss user flow, explore alternatives, get cross-functional feedback, allow different job functions to contribute
- Materials: printed handouts, wall displays, large display/projector
- Rules: start with clarifying questions, listen before speaking, lead into alternatives, be gentle with problems, avoid absolutes, speak from your point of view
- Running the meeting: like a focus group, help less assertive participants, takes maturity not to feel threatened
7.4 Heuristic Evaluation (Nielsen & Molich)
- Expert evaluation using simple and general heuristics
- Display-based, can be used in all phases including storyboards
- Process: trained analysts with typical usage scenario, two passes (familiarize, then examine), each rates severity, individual assessments compared
- 10 Heuristics: visibility of system status, match between system and real world, user control and freedom, consistency and standards, error prevention, recognition rather than recall, flexibility and efficiency, aesthetic and minimalist design, help users recognize/diagnose/recover from errors, help and documentation
- Severity: frequency × impact × persistence; Nielsen’s scale 0 (not a problem) to 4 (catastrophe)
- Evaluator convergence: more evaluators find more problems (diminishing returns)
- Scorecard: problem description, recommended solution, heuristics violated
7.5 Cognitive Walkthrough
- Cognitive task analysis focusing on processes needed to perform tasks
- Preparation: representative tasks, user population, context, action sequences, initial goal; complex tasks require decomposition
- Walkthrough: step through each action; specify goal structure, interface behavior, difficult actions, source of problems
- Evaluate goals/sub-goals: will user try to achieve effect? Notice correct action available? Understand how to achieve subtask? Get feedback?
- Example: ATM cash withdrawal (enter PIN, obtain cash — with subtasks)
- CW vs. HE: CW more goal/task-specific, requires more preparation, more explicit structure; HE more holistic, clear standards to judge against
- Hybrid: combine explicit goal/task structure of CW with heuristic standards of HE
7.6 Usability Testing
- Most popular evaluation method; semi-controlled settings; potential users; task-based
- Definition: “extent to which product can be used by specified users to achieve specified goals with effectiveness, efficiency, and satisfaction in a specified context of use”
- Mindset: opportunity to identify weak links, not confirm brilliance; no “stupid users,” only flawed designs
- Outsourcing: impartial assessment vs. missing opportunity to ask domain questions
- Flow: introduction/instructions → tasks one at a time with think-aloud → analysts observe, ask questions, note problems, rate performance → discuss after each task
- Instructions: stress testing system not user, no wrong answers, set expectations for incomplete systems
- Developing tasks: test critical paths, clear goals, complex enough for multiple steps, not too complex for minimal training
- Think-aloud: verbalize thought process; unnatural, requires continuous probing (“what are you looking for now?”)
- Observer role: neutral (probing, no assistance) or active participant; decide in advance on help/clues
- Scorecard: task, problems, severity (same as heuristic evaluation)
- Software: Morae (video of screen, webcam, event logging); working document for video analysis (verbatim, time-stamped every 10–30 seconds)
7.7 Field/Feasibility Evaluation
- Once software deployed in limited settings, preferably during pilot
- Researcher-driven: analyst present, observe interaction, ask questions; hybrid of lab and ethnography; naturalistic setting with constraints
- Remote: system has built-in features to probe reactions
- Detailed records: video capture, detailed notes
8. Ethics and Human Subjects Research
This is about how subjects will be protected from research risk. Identifies inclusion of women, minorities, and children, and addresses Ethical concerns.
8.1 Historical Cases
- Tuskegee Syphilis Study (1932–1972): long-term study of black males, no informed consent, continued after penicillin discovered
- Nazi Medical War Crimes (WWII): thousands of experiments on concentration camp prisoners; Nuremberg tribunal
- Cold War Radiation Experiments: US government-sponsored, involved radioactive tracers without awareness/consent
- Jewish Chronic Disease Hospital Study: live cancer cells injected, oral consent only, patients not informed; researchers found guilty
- Willowbrook Study: children deliberately infected with hepatitis, parents could not admit children without consent
- Jesse Gelsinger (1999): gene therapy trial at UPenn; substitute inclusion, unreported side effects, financial conflicts
8.2 Nuremberg Code
- Voluntary consent
- Must yield necessary and generalizable knowledge
- Animal experimentation first
- Avoid all suffering and injury
- No experiment if belief death/disabling injury will occur
- Risks never exceed importance of problem
- Risks should be minimized
- Scientifically qualified investigators
- Subjects may withdraw
- Investigators must end if continuing likely to cause injury/disability/death
8.3 Belmont Report (1978)
- Respect for persons
Individuals as autonomous agents, informed consent, disclosure, confidentiality, additional protections for diminished autonomy, avoid coercion/excessive compensation - Beneficence
Do no harm, maximize benefits, scientifically sound design, acceptable risk-benefit ratio, minimize physical and psychosocial harm - Justice
Fair distribution of benefits and burdens, vulnerable populations, fair distribution of research
8.4 HIPAA
- Insurance portability, accountability (fraud enforcement), administrative simplification
- Privacy: individuals’ rights to control access to PHI; organizations required to control confidentiality
- PHI identifiers: names, MRNs, addresses, phone/fax, SSNs, emails, dates, certificate numbers, account numbers, relatives, voiceprints, fingerprints, photos, device identifiers, biometric identifiers, any identifying characteristics
- Restrictions on disclosure: only for treatment, payment, operations (TPO)
- Basic practices: no shared access, no public discussion, no unattended hard copies, encrypted storage, no unattended screens
- ARRA amendments: breach notification, accounting of disclosures, prohibition on sale of EHR/PHI, penalties
8.5 Institutional Review Board
- Defined per institution; participants mostly researchers plus community members, legal/ethical experts
- Reviews: risks minimized, risks reasonable relative to benefits, equitable participant selection, informed consent, confidentiality
- IRB not required for practice improvement activities (but cannot publish results)
- Why IRB is always a good idea: forces deliberation of methods, risks/benefits; can catch oversights; not every study requires written consent (can apply for waiver)
- Exemptions: surveys/interviews/observations of public behavior (unless identifiable with risk), existing de-identified records, normal educational practices
- Expedited review: by single member; examples include noninvasive specimen collection, data from existing records, research on behavior/cognition/communication
8.6 Evaluating Research Proposals
- Criterion scoring (1–9 each): significance, approach, innovation, investigator, environment
- Simplified framework: Factor 1 (importance: significance + innovation), Factor 2 (rigor: approach), Factor 3 (expertise: investigator + environment, no individual score)
- Overall impact score (1–9) by entire panel, allows weighting
- NIH scoring guidelines
- Why proposals are rejected: ill-defined objectives, wrong scope, lack of integration, idea already tried, poor approach, cost, insufficient information, not appropriate investigator/institution
9. Research Infrastructure
9.1 Organizing a Study
- Enumerate project roles: evaluation team (computer scientist, ethnographer, statistician, informatician, clinician, economist, manager)
- Define questions, external review and quality assurance, define resources
9.2 Research in Informatics
- Methodologically draws on clinical research, psychology, social science, epidemiology
- Observational research: applying informatics methods for biomedical discovery
- Interventions research: improving clinical practice, health, wellness with informatics solutions
9.3 Data Analysis Software
- Matlab/Octave, R, SPSS, SAS, Maxima/Sage/Axiom
- Research applications: Morae (usability), NVivo (qualitative), clinical research packages (Velos, Oracle Clinical)
9.4 Querying Data
- Organize, sort, filter, view
- Exploratory data analysis; often requires creating new variables (continuous → dichotomous)
9.5 Data Reporting
- Aggregate findings in publications
- Actual data into research data banks (de-identified)
- Trial banks: International Clinical Trials Registry Platform
9.6 Data Sharing
- Data sharing plans required for many federally funded trials/publications
- Results, actual data, model organisms, genome-wide associations
- Provisions specified in informed consent or post-collection
- Requires data sharing agreements
9.7 Limited Data Sets and PHI
- Limited data set removes: name, SSN, address/contact, certificate/license numbers, vehicle/serial numbers, URLs/IPs, photos, MRN/health plan identifiers, device identifiers, biometric identifiers; requires data use agreement
- PHI adds: geographical subdivisions 20K people, dates other than year, any unique identifying code (except investigator-assigned)