DNA, Genetics, and Gene Regulation
Discussion on Central Dogma. DNA → RNA → Protein. Every step has intermediate regulatory processes.
Now think of if you have DNA in isolation. Can you claim to understand every single thing about the cell/organism?
The cellular environment encodes how the DNA is expressed. It’s a dynamical system. DNA is a kind of storage mechanism. The cell encodes all the context (neuron, liver cell). DNA is expressed depending on where it is. DNA foundation models trained on sequences alone have a fundamental problem.
3.2 billion base pairs, 4 nucleotides (ATGC, A-T & G-C via Hydrogen bonds, RNA has “U” instead of T). 20,000 protein-coding genes. ~1-2% is involved here (exome). The remainder is regulatory, undercharacterized (it’s not “junk”! Evolution has a lot of pressure to avoid waste.) ML scale is hard because of this scale.
When we sequence people, we’re not sequencing their genome. We have a reference genome (a “typical” genome; GRCh38.) People are sequenced relative to this.
You can view DNA at three broad scales: Molecular → Structural → Chromosomal.
Genetic Variants
SNPs (single nucleotide) — most common, about ~4-5M per person. There’s also Copy Number Variation (copy multiple parts of the gene.)
Minor Allele Frequency.
There’s a genotype matrix: people times SNPs where each element is copies of alternate allele.
Measuring
SNP Arrays (targeted, ~500K-5M SNPs), Whole Exome Sequencing (better coverage; focus on proteins), and Whole Genome Sequencing.
Each has its applications. E.g. BRCA 1/2 testing, pharmacogenomics.
Some DBs are gnomAD, ClinVar, GWAS Catalog, 1000Genomes.
Population Structure
What part of genetic data are you capturing about the population versus the individual?
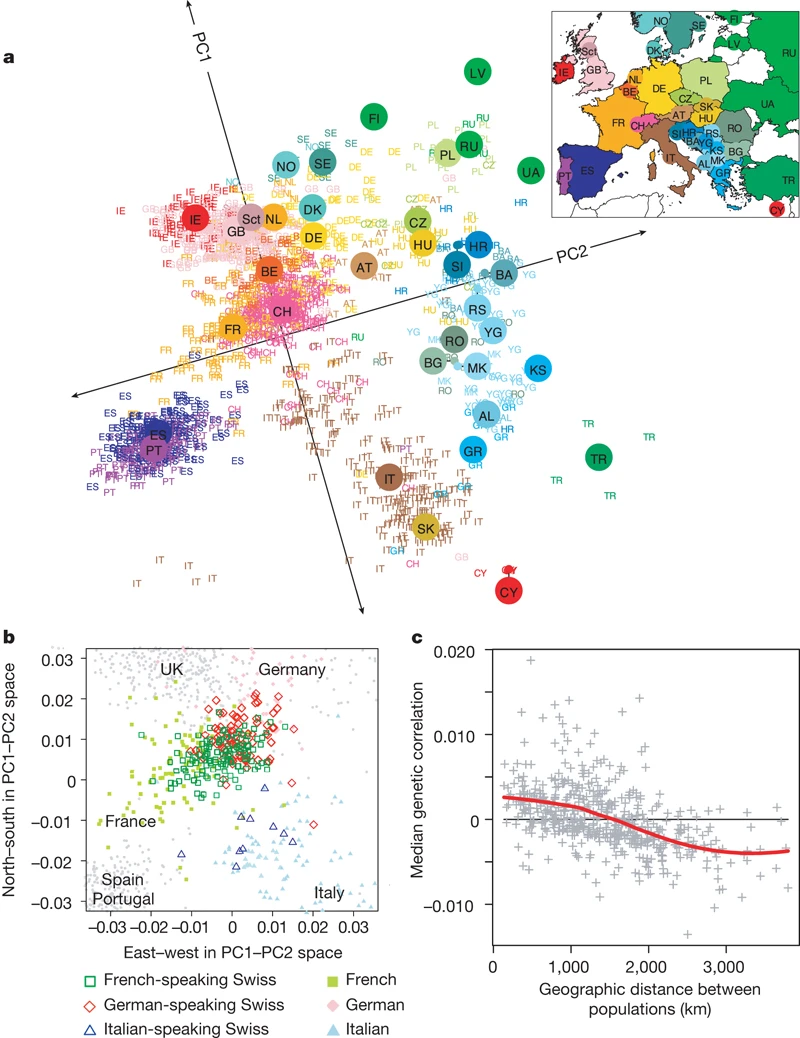
Novembre et al, 2008 and PCA. They took 200K SNPs from 1,400 Europeans and had two PCA axes. The axis that explained the SNPs the most was ancestry and not disease! They literally tilted the 2-d chart slightly and it looked like a map of Europe! This is nuts. Genes mirror geography. Ancestry was the dominant signal.
TODO: Data → PCA → … Remove the lower contributing data points/dimensions?
In ML
A naive classifier will learn ancestry and call it “disease risk”: any ancestry group with higher prevalence of disease will be flagged as high-risk.
Linkage Disequilibrium
Variants on the same Chromosome are co-inherited. Think of this as multi-collinearity in regression. Things are not independent. TODO: More on this…
GWAS
The idea is to find a SNP associated with a trait. Test each SNP independently (X^2 or logistic regression for binary, regression for continuous.)
This is not the same as ML! GWAS asks “Is not zero (at a significant level)?” — goal is to find which variants matter and ‘screen’ for features. “Is the SNP sifficiently enriched with the disease state of interest?”
You cannot use a multivariate model because you have 5M coefficients and 500K people. You will get an overfit model that won’t generalize and will be very sensitive. If the goal is not prediction but to estimate effect size …TODO? GWAS reports effect sizes ( or Odds Ratio (typically 1.05-1.20)).
TODO: Manhattan Plot, QQ Plot
Genotype to Phenotype
Genetic Variant → Gene Expression → Protein (vary in level/function) → Phenotype
SNPs mostly live in the non-coding regions. How do they affect things? Idea is that they are amongst regulatory regions (like promoter, enhancer regions). So your SNP could affect how much is made and where.
mRNA
This is produced from DNA. RNASeq: You need to destroy the cell. Sequence the mRNA. Table of which genes you saw and the samples.
You can also look like which proteins are present (proteomics) and metabolic products (metabolomics).